Thursday, December 20, 2012

Basura Plays : The Looper


This stock really loves to do a loop in time. 
But I wonder if things will be different this time around.


Post Update 12.22.2012

If prices consolidates above .375 in the next two trading weeks,
we might have something here. - Next BHI/PHES?
(Click Image To Enlarge)


For your own safety, please follow your OWN trading plan 
and do not believe the crazy trader. Hihihihi.


Ideal Buy Price @ .375 / 38
Cutpoint = If prices closes below .375
(Darvas Method)


Additional Notes:
Jockeyed Stock, has high Volatility, and is currently in a "Slightly Liquid" state.
Expect another +50% Upside If Recent 52-Week High Gets Broken.

Wednesday, December 19, 2012

Bounce Plays : TSI


Ladies and Gents, you just witnessed a classic Pump and Dump.


TSI on Review:


Fact 1: TSI denies backdoor rumors. Killing off the speculative catalyst.
http://www.pse.com.ph/resource/disclosures/2012/pdf/dc2012-9099_TSI.pdf

Fact 2: By tomorrow 12/20/2012, around 30M Shares will be released from lockup.
http://www.pse.com.ph/resource/disclosures/2012/pdf/dc2012-9068_TSI.pdf


Here is TSI Chart as of 12/18/2012


Under Normal Circumstances, the 61.8 OR 76.4 Fibo's should hold just fine for a possible bounce.
But with those shares ready to be unlocked by tomorrow, we might just see this dragged to hell.

That's just me though.


TSI's "End of the World" Just got a day earlier.


Sunday, December 2, 2012

Hello December


MIC Test! MIC Test!


Hello December!


Monday, November 19, 2012

Thursday, November 8, 2012

Market Thoughts : APM Bounce Play


APM today was like Skyfall!
A little better since you get your money 
back (and more) if you played the bounce.


APM was like... 


And Then...


Saturday, October 27, 2012

Basura Plays 101: Its PWR All Over Again!


Or Is It?


(Click Image To Enlarge)


But unlike PWR that had no "other" resistances, VITA still has one more to take out @ 1.72


It's Amazing how players and the market as a whole react to certain patterns. But of course, there's always that possibility that the market and players have changed. Trade with caution.


Update 10.29.2012


It could have mimicked PWR if it closed near the highs. 
But alas it did not. Too bad.


Related Posts:


Thursday, October 25, 2012

Wednesday, October 24, 2012

Market Thoughts : APM


These are not the disclosures you are looking for...


What if there was more to all those APM disclosures that were thrown at the table? 
Or what if they were just part of a big fat bluff?


Would you still play at current prices?


Photo Taken from http://www.flickr.com/photos/enelson81/4553402942/


APM is now the stock of the decade.


Too much speculation...
But whatever they say, Price Action is King!
Breakdown @ .144 = Bye!
Breakout @ .169 = Buy!


Related Post:
http://zeefreaks.blogspot.com/2012/10/apm-blowoff.html


Thursday, October 11, 2012

GREEN : Distribution or Breakout?


Some say Distribution,
Others say Breakout.
What say The Jockeys?
And what say You?


(Click Images to Enlarge)


Multi Year Chart - Weekly View

1 Year Chart - Weekly view


Recent Points of Interest:


"Pursuant to the Investment Agreement, Cleantech (i) subscribed to 20,776,856,000 
primary shares of the Company for a total subscription price of PhP415,537,300.00, 
and (ii) was issued two (2) Warrant Certificates under the American call option covering 
10,489,500,000 shares of the Company with a strike price of P0.02 per share and 
10,489,500,000 shares of the Company with a strike price of P0.03 per share, 
exercisable within 1 year and 3 years from issuance, respectively."


Please be informed that on September 14, 2012, Greenergy Holdings Incorporated (the 
“Company”, formerly MUSX Corporation) entered into a preliminary agreement (“Term 
Sheet”)  with  Hydroring Capital BV  (“HC”)  for the development, operation and 
management of multiple hydropower projects, infrastructures and/or facilities  in the 
Philippines using the “Hydroring”-concept, with the aim of providing affordable access to 
environmentally friendly and sustainable sources of renewable energy.  HC is a Dutch 
enterprise which has developed a hydropower concept based on a portfolio of proprietary 
turbine innovations with a variety of added value components.


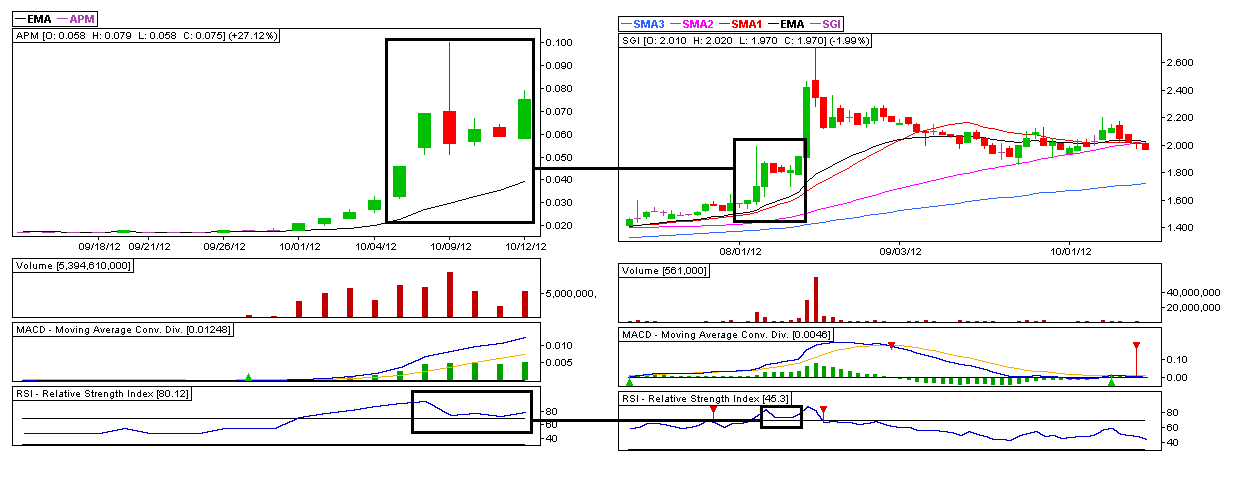
APM : Blowoff


"Just BUY Tomorrow and Enjoy the "JUMP" in the coming days."


APM 6 month Weekly Chart 10.11.2012


Update 10.12.2012

One last hurrah before the fall?
I know both these stock are different but chartwise similar.


(Click Image to Enlarge)


http://t.co/rDGpzX4R


Update 10.16.2012


Should there be another decline tomorrow. 

Bullish = price not going below .088 or .091 (the higher the better) + volume not greater than today's


Update 10.19.2012


The next two trading days will be critical.


Update 10.24.2012


If there will be another decline/(consolidation) in the coming days,
Bullish = Price not closing below .15/.151 + Volume not higher than today's

Always set your stops.


Update 10.27.2012


We should see a clear direction on where this is heading within the next 1-2 trading days. 
Any close on or above the .16 Level would be considered bullish. Peg your Stop on .144


Monday, October 8, 2012

Borg Stocks and Trailing Stops


Last year it was PWR, MET, and AAI
This Year it's LMG, MAKE and APM!


Don't you just love BORG stocks?

For those of you who don't know about the Borg from the Star Trek Series, 
Well.. Borgs are the merciless living nightmares of the vast galaxy that either assimilates 
or destroys any sentient race in its path.


And the Borg's favorite pickup line?


Yes. Once the Borg Collective makes a move, resistance will be like a hot knife through butter.

Borg Stocks are just like that

They usually manifest themselves after a breakout from an ATH (All Time High) Resistance or a Multi Year Resistance. They make gaps as they go through the days, and even defy the natural laws of the RSI Gravity.

The catalyst for this phenomenon is usually unknown especially during the rise.


So how do we play with these bad ass stocks?


Buy on Breakout and Set Trailing Stops.


I don't know about you but this works for me. 
There are many ways to set trailing stops. 
Find that which suits your trading style best.


APM Chart


APM Chart 10.8.2012
APM Chart 10.9.2012


Be sure to SELL when your stop is hit.
Trust me... You don't want to be holding a dead Borg.


Monday, September 24, 2012

Sleepers : UNI


To Accumulate or Not To Accumulate.
EVER's Tandem, The UNIcorn.


Thursday, September 6, 2012

Hello September


Nothing really new to post. 
New plays and their charts updated on my twitter. 


Saturday, August 11, 2012

Sunday, July 29, 2012

Thoughts in Arts : ABA


The Market is dark and full of terrors...


(Click Image to Enlarge)


While Distribution is evident in ABA. 
It does not mean price will NOT go up.


Saturday, July 14, 2012

Swing Trading vs. Trend Following


Select Your Race


This post is dedicated to all the newbies at Newtoys Tinychat. 
This is just a snapshot, coupled with some of my thoughts, of how Swing Trading and Trend Following look like. 
If you would like to learn more about the methods mentioned here, do your homework and Google it.


Usual Swing Trader Chart - WITHOUT the other indicators (MACD, RSI, STS, OBV, etc.)

Looking at this chart - a swing trader would have 10 times the opportunity to make a killing trade on PXP. 
But doing so requires a lot of time, effort, knowledge and guts to be able to successfully make the trade...


Rewards are Greater in Swing Trading.

But so are the RISKS.


Now to Trend Following:


Trend Follower's Chart - Effective even with only one indicator : The Moving Averages.


Trend followers on the other hand, buy and hold stocks until one of their selected moving averages "snaps." 


In this case, following the 20 Day MA which hasn't snapped... YET!


This method can oftentimes be stress-free and only requires the trend follower to be patient.


So to the Padawans, you could try doing both and see for yourself which method suits you. 
Choose your path wisely. Your Trades Reflect your Character.


Here's some stats I gathered that might help.


But whatever side you're on, what matters is that by the end of the trade, you make a profit.


Monday, July 2, 2012

Investor Mode : PNB


Using TA, I'm trying to find and "time" good
[strong fundamentals] stocks for long term investment.


Not really the best of banks, but it's one of the best bank stocks to trade in the market.


It's been a while since I last did this...
This is my second time to post under 'Investor Mode' tag.. You know me, I love volatility!
But I make special cases especially when I see potential future flyers.

Here's my last post under Investor Mode:


Here are your PNB Charts:


(Click Images to Enlarge)

PNB 6 Months Daily View


(PNB All time Weekly Chart)


By the way, PNB Registered Php103,703,313 NFB Today.


Something's cooking.. Maybe something in their 1st half reports..
Maybe something else... But of course... that's all in my crazy head...


As one of my teachers in FM put it:
"Price Action Always Ahead of News..."


If those key resistances are breached, HOLD until your greed is satisfied. Hihihihi. 


Buy on dips... Follow the trend...


Timeframe: 3-6 Months
PD: None as of the moment.


Wednesday, June 27, 2012

Thoughts in Arts: Window Dressing Time


After seeing the chart of our beloved Ms. Market... 
This picture came into mind:


PCOMP 6 Month Chart (6.27.2012)


2 Days Left till Friday And Ms. Market's gonna be like...


...


...


Wednesday, May 23, 2012

How Accumulation Looks Like


Months ago one of my trading friends was asking me about this one particular stock he had - VLL. He told me about how great the company was doing and kept bugging me questions on how the chart looked, how the PA (price action) was, etc..  It’s a good stock. No doubt about that – fundamentally and technically.

And so I was able to monitor its movements – never got to trade it though.


I'd like to be very clear about this: I don't have any VLL shares nor do I plan to buy.


Just recently, my friend from before asked me again how his stock was doing. This time he was hesitant and was very particular on the BID/ASK board.

Now, one thing that was so interesting about this stock is the continuous accumulation and price control that was so obvious if you paid attention to the ticker, especially during the last minutes of every trading day.


Here's Broker Transactions for this week:
(Click Image to Enlarge)


*This is just an example, may or may not be true.
** You'll get the lion & scarecrow thingy later. ;)


Another thing that interests me now is how the stock has been
 resilient even when Ms. Market has gone mad!

"You're next! And you're Going Down!!!"

Before I go on further, I’d like to throw in this question:
Why and When do fundies, big or small accumulate a stock?
         Answer: They do so when they know that the current price is
low, undervalued, or whatever you may call it, 
and foresee an increase in the stock’s future value.

Ok, now that that’s out of the way, I would like to attempt to explain the accumulation process 
especially when you look at the BID/ASK board. This board represents a lot of statistics and psychology. 
It shows the demand/supply of shares, greed/fear factor, blah blah blah…


Ok ok.. Now I’m sounding a bit too Un-Zeefreaks like. So how about this:


(Click Image Below to Enlarge)


VLL Bid/Ask Board as of 5.23.2012

Don’t you just feel like screaming and pressing that sell button once you see those big walls on the ask side on your favorite stock?

Those basterds, the lions and scarecrows have gone cahoots! And they're out to steal your precious shares!!! They throw big ask orders to scare those who dare look at the board and give them the impression that prices will not go further; While doing this, they bid low and in small amounts, giving the impression that demand is low and that prices are likely to fall. And these small bids don't run out - you sell... and THEY fill the bid orders again and again
 until YOU run out. (We call this "Iceberg" buying)

This process flushes out the "weak hands" and at the same time draws just the right candle on the chart. 
As they say, it's like hitting two birds with one stone.

Accumulation takes time.
Patience is the name of the game.

Now the question is… Will you give in and be eaten?


Here’s another way of looking at the accumulation process:


Yes. Accumulation can be a very nasty phase.
It’s Survival of the fittest.
Eat or Be Eaten.
Period.