Just for the Archives.
Studies included in the charts.
(Click Images to Enlarge)
Studies included in the charts.
(Click Images to Enlarge)
2 Categories of ZS 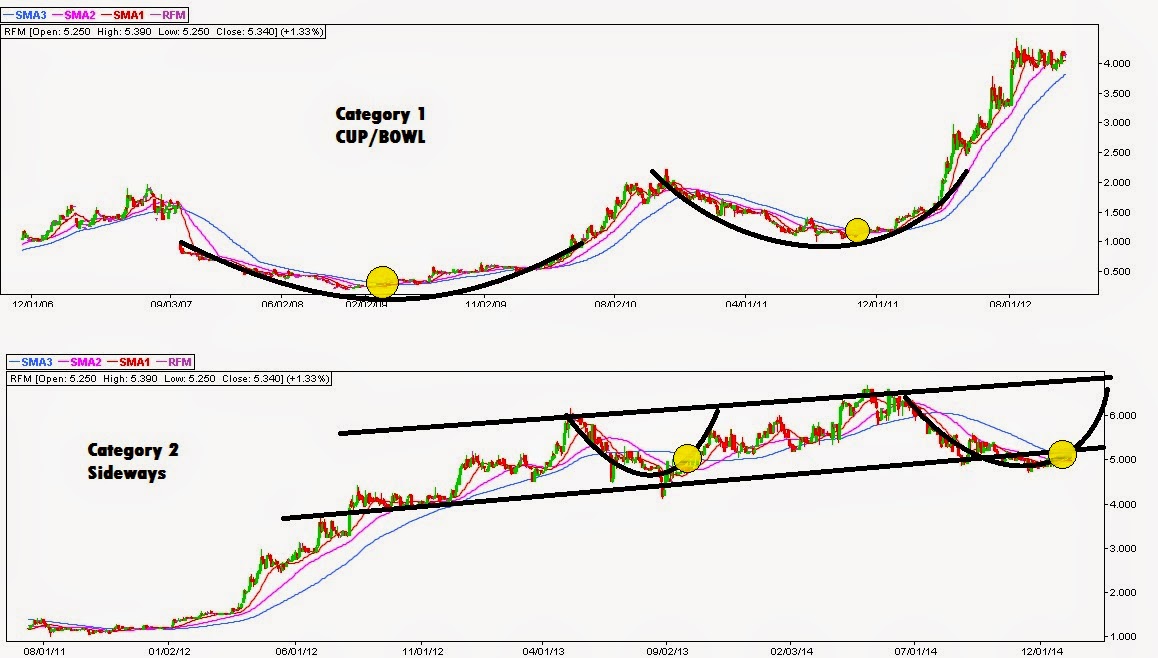 Volatility Galore 

 
Tracer's "N" Factor  | ||

Daily vs. Weekly Charts
When the charts don't make sense, try a different perspective...


You might get lucky and get front row tickets to great shows if you do.
Minute Charts
When volatility matters more than the RSI


TDY - 5 Min Chart
MJC - 3 Min chart
Parabolics & The Subtle Breakout


Here's a good study on RSI by Spyfrat:
 |
(Click Image to Go to Spyfrat's post) |
The Sling-Shot Effect


The "Pull" Just Before Blasting OFF!
Same as the Cup and Handle Pattern.
Only without the Cup...
The Snowball Effect
What happens in the minutes chart when a
major Darvas resistance gets taken out...

The Unsuspended
Stocks with the craziest volatility.


Fractals
Pattern within a pattern.
