Months ago one of my trading friends was asking me about this
one particular stock he had - VLL. He told me about how great the company was
doing and kept bugging me questions on how the chart looked, how the PA (price
action) was, etc.. It’s a good stock. No
doubt about that – fundamentally and technically.
And so I was able to monitor its movements – never got to
trade it though.


I'd like to be very clear about this: I don't have any VLL shares nor do I plan to buy.
Just recently, my friend from before asked me again how his
stock was doing. This time he was hesitant and was very particular on the BID/ASK board.
Now, one thing that was so interesting about this stock is
the continuous accumulation and price control that was so obvious if you paid
attention to the ticker, especially during the last minutes of every trading
day.
Here's Broker Transactions for this week:
(Click Image to Enlarge)
Here's Broker Transactions for this week:
(Click Image to Enlarge)
*This is just an example, may or may not be true.
** You'll get the lion & scarecrow thingy later. ;)
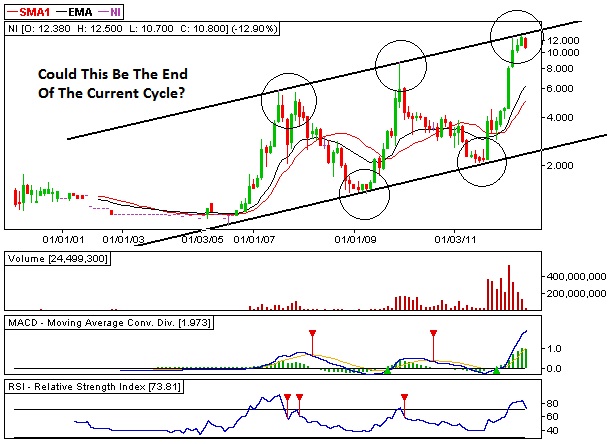
Another thing that interests me now is how the stock has
been
resilient even when Ms. Market has gone mad!
 "You're next! And you're Going Down!!!"
resilient even when Ms. Market has gone mad!

Before I go on further, I’d like to throw in this question:
Why and When do fundies, big or small accumulate a stock?
Answer: They do so when they know that the current price is
low, undervalued, or whatever you may call it,
and foresee an increase in the stock’s future value.
Answer: They do so when they know that the current price is
low, undervalued, or whatever you may call it,
and foresee an increase in the stock’s future value.
Ok, now that that’s out of the way, I would like to attempt to explain the accumulation process
especially when you look at the BID/ASK board. This board represents a lot of statistics and psychology.
It shows the demand/supply of shares, greed/fear factor, blah blah blah…
Ok ok.. Now I’m sounding a bit too Un-Zeefreaks like. So how
about this:
(Click Image Below to Enlarge)

VLL Bid/Ask Board as of 5.23.2012
Don’t you just feel like screaming and pressing that
sell button once you see those big walls on the ask side on your favorite stock?
Those basterds, the lions and scarecrows have gone cahoots! And they're out to steal your precious shares!!! They throw big ask orders to scare
those who dare look at the board and give them the impression that prices will
not go further; While doing this, they bid low and in small amounts, giving the impression that
demand is low and that prices are likely to fall. And these small bids don't run out - you sell... and THEY fill the bid orders again and again
until YOU run out. (We call this "Iceberg" buying)
This process flushes out the "weak hands" and at the same time draws just the right candle on the chart.
As they say, it's like hitting two birds with one stone.
Accumulation takes time.
Patience is the name of the game.
Now the question is… Will you give in and be eaten?
Here’s another way of looking at the accumulation process:

Yes. Accumulation can be a very nasty phase.
It’s Survival of the fittest.
Eat or Be Eaten.
Period.
Eat or Be Eaten.
Period.